 Second Opinion®
Trade Trigger
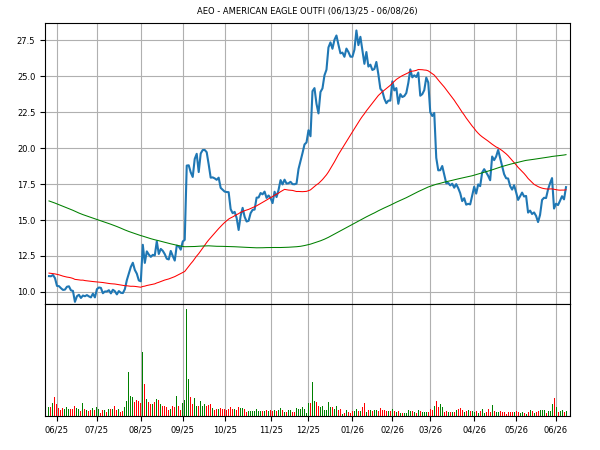
: AMERICAN EAGLE OUTFITTERS INC (AEO)
Trade Trigger stocks are breaking through significant resistance (bullish) or support (bearish) areas.
Second Opinion®
Trade Trigger
: AMERICAN EAGLE OUTFITTERS INC (AEO)
Trade Trigger stocks are breaking through significant resistance (bullish) or support (bearish) areas.
Report created after market close on 06/08/26
Report created after market close on 06/08/26
Neutral
MarketEdge® Second Opinion
From Avoid on 06/01/2026
Price At Upgrade
 9.4%
9.4%
Change Since Upgrade
Recommendation
Trade Activity for: 06/08/26
Close |
17.29 |
Change |
0.85 |
Volume |
54250 |
Open |
16.47 |
High |
17.51 |
Low |
16.42 |
MarketEdge Indicators
Opinion Score |
Power Rating |

Strongly Improving |
Bearish
Bullish
51 |
Annual Chart
 Get Alerted
33% Off for Schwab Customers - $19.95/mo.
Comment
The stock is underperforming the market over the last 50 trading days when compared to the S&P 500. The MACD-LT, an intermediate-term trend indicator, is bullish at this time. AEO's chart formation suggests an upward trend is beginning. stock is in the early stages of a rising trend. A close above $17.98 is a number to watch to confirm a trend reversal.Momentum as measured by the 14-day RSI is gaining in strength. The stock is in a short-term overbought condition based on a Slow % K stochastic reading of 80 or higher. Over the last 50 trading sessions, there has been more volume on up days than on down days, indicating that AEO is under accumulation, which is a bullish condition. The stock is trading above a rising 50-day moving average which confirms the improving technical condition. A move in price above the 200-day moving average will add to the improving technical condition of AEO.
Subscribe to MarketEdge to get our daily comment for AEO.
Yr. High/Yr. Low |
28.46 | 9.27 | |
MO Chg.(%) |
3.7% | ||
Trend Line Resistance |
0 |
Trend Line Support |
0 |
|---|---|---|---|
Entry Price |
17.98 | ||
Volatility(%) |
4.8 | ||
Position |
70 | ||
ADXR |
21 | ||
Avg Volume(00) |
62587 | ||
MO Chg.(%) |
38.2% | ||
U/D Ratio/Slope |
1.1 | Up | |
On Balance Volume |
Bullish | ||
Positive OBV |
Bullish | ||
Negative OBV |
Bullish | ||
Money Flow (MF) |
78 | ||
MF Slope |
Bullish | ||
Alpha/Beta |
0 | 1.88 | |
B.Bands |
20 | ||
MACD ST/LT |
Bullish | Bullish | |
50-Day R.S. |
0.94 | ||
Wilder's RSI |
55 | ||
Sto. Fast/Slow |
88 | 89 | |
OBOS/RSV |
0 | 83 | |
C-Rate |
0 | ||
| Moving Average | Price | % | Slope |
|---|---|---|---|
| 10 Day | 16.73 | 103 | Up |
| 21 Day | 16.24 | 106 | Up |
| 50 Day | 17.11 | 101 | Up |
| 200 Day | 19.55 | 88 | Up |
Past performance is not a guarantee of future results. The data contained in MarketEdge is obtained from sources considered by Computrade Systems, Inc. to be reliable but the accuracy and completeness thereof are not guaranteed. Computrade Systems, Inc. does not and will not warrant the performance and results that may be obtained while using the MarketEdge research service. The MarketEdge research service & Second Opinion are neither offers to sell nor solicitations of offers to buy any security. Company profile, estimates and financials provided by S&P Global See User Agreement for other disclaimers. MarketEdge and Second Opinion are registered trademarks of Computrade Systems, Inc. © 2018 Computrade Systems, Inc.© 2018 The McGraw-Hill Companies, Inc. S&P Global is a division of The McGraw-Hill Companies, Inc. See full Copyright for details.