 The Right Stock At The Right Time®
| The Right Stock At The Right Time® |
|
||
|
Candlestick Charts 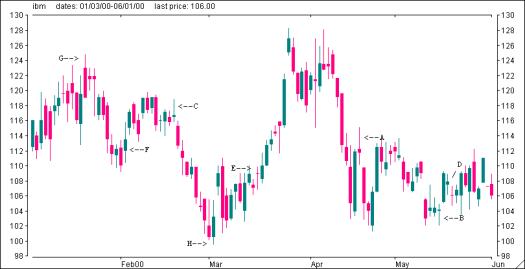 Minor Chart Formations: A) Star: Stars indicate reversals. A star is a small body candlestick that occurs after a candlestick with a large body and the bodies don't overlap. B) Hammer: A small body and a long lower shadow. The body can either be red or green. This is a bullish candle if followed by a significant up-trend. C) Hanging Man: The opposite of a hammer, small body and a long upper shadow. This is a bearish candle if followed by a significant down-trend. D) Harami: A formation which denotes a decrease in momentum. It occurs when a candle with a small body follows a candle with a large body. A red candle followed by a green candle would suggest a decrease in downward momentum. The opposite scenario, a green candle followed by a red one, would indicate a decrease in upward momentum. E) Doji: Open and close are the same price. Dojis reflect indecision. F) Piercing Line: A two-candle formation when the first candle is a long red line followed by a long green line candle. The second candle opens lower than the first candles close and closes above the first candles mid-point. This is a bullish pattern. G) Shooting Star: A two-candle configuration that signals a minor bearish reversal if it occurs after a rally. The first candle is a long green line followed by a star candle with a long upper shadow. H) Morning Star: A bullish configuration consisting of three candles. The first candle is a long red line followed by a red or green star. The third candle is a long green line. 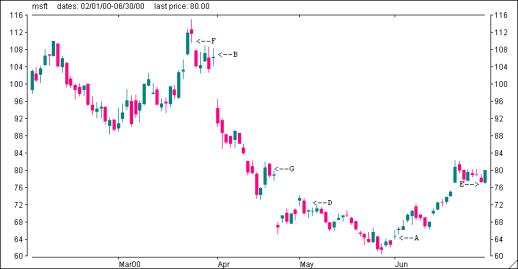 Major Chart Formations: The following are the most significant major bullish/bearish chart formations. An example of each is located on the above chart of MSFT with the exception of C (Abandoned Baby Doji). A) Gravestone Doji: A doji (open and close are the same) and the high is significantly higher than the open, high and closing prices. This formation typically occurs at the bottom of a trend and signals a bullish reversal. B) Dragonfly Doji: A doji (open and close are the same) and the low is significantly lower than the open, high and closing prices. This formation typically occurs at the top of a trend and signals a bearish reversal. C) Abandoned Baby Doji: A doji, which occurs at the bottom of a chart formation with gaps on both sides of the doji. D) Harami Cross: This formation signals a market top. It consists of a harami, which is a long black line candlestick which precedes and engulfs a doji with no body. E) Engulfing Pattern: A two-candle bullish formation consisting of a small long red line engulfed by the second candle, a long green line. F) Evening Star: A bearish pattern usually occurring at a top. The formation consists of three candles. The first is a long green line followed by a star and then a long red line. The star can be either red or green. G) Dark Cloud Cover: A two candle formation whereby the first candle is a long green line and the second candle is a long red line whose body is below the center of the first candle. This is a bearish formation. The Market Edge 'Smart Chart ' component provides candlestick charting along with bar, line and Point & Figure charting capabilities. To activate Smart Chart, click on 'Launch Smart Chart' located in the upper right hand corner of any page. Click on 'Chart Type' and then on 'Candle".
|
 Developed by the Japanese in the 1600's, candlestick charts are merely bar charts that extend the relationship between open, high, low and closing prices. Each candlestick represents one period of data (day-week) and consists of an upper shadow, lower shadow and the body. The upper shadow is the highest price that the stock traded at for the period while the lower shadow represents the lowest price. The candlestick body is red when the close is less than the open or green when the close is greater than the open. The top of the body is the opening price if the candle is red and the candle is referred to as a long red line candle. If the candle is green, the top of the body is the closing price and the candle is referred to as a long green line candle. The bottom of the body is the opening price if the candle is green or the closing price if the body is red. There are many different candlestick formations. Some are considered to be minor formations while others are major.