 The Right Stock At The Right Time®
| The Right Stock At The Right Time® |
|
||
|
Classic Chart Formations
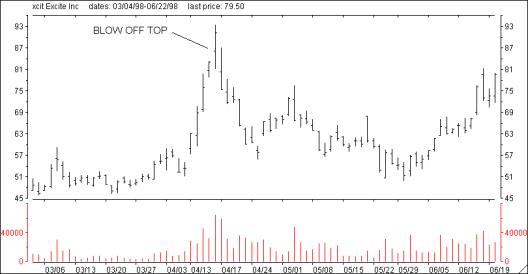
Blow Off Tops
Often bull to bear market transitions follow what is referred to as a "blow off top". Although this condition is not necessary for a major reversal to develop, it is critical that you have an understanding of its structure and act accordingly if one occurs. A blow off top usually occurs in the final phase of an extended up move. The blow off takes place on very high volume as the stock explodes to the upside, reverses and closes down for the day. The dynamics that create a blow off top develop from a buying exhaustion by the bulls who unload all of their firepower and are then overwhelmed by the supply of stock that comes out of the woodwork by the bears. Typically, this type of action occurs after a sustained advance that deletes the bull's cash reserves and, thus, support for the stock. If you ever experience a blow off top, prepare for an extended bear phase to develop. The chart located below of Excite is a good example of a blow off top that occurred in mid-April 1998 as the stock spiked to 93 prior to trading down to the mid-70's the following day.
Frequently, a bear to bull market transition follows what is referred to as a "selling climax". A selling climax usually occurs in the final phases of a bear market but can also occur at the end of a corrective phase. Typically, the stock or index will have been in a long downtrend. The reversal occurs on very high volume as the stock collapses to the downside, reverses and closes up for the day. As with blow off tops, an imbalance occurs as the crowd throws in the towel convinced that the stock is going to zero. Since this usually occurs after a sustained sell off, cash is abundant creating the fuel to launch a new bull phase. A selling climax usually spells the end of a bear phase and the beginning of a sustained up move. The chart below shows a selling cimax that occurred in mid-July 1996 which set the stage for a rally by the Dow for the remainder of the year. 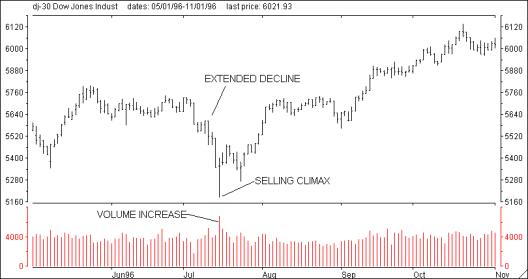
Many times a stock or index will decline for a period of time and then begin what appears to be a significant rally. Typically, this move will extend over a long period of time and penetrate the 50-day simple moving average. From a bar chart, measure the total number of points from the previous peak to the most recent bottom. As the stock rallies, if it gains more than 50% of the prior decline, the odds are very high that it will recover the entire loss. The faster the 50% retracement occurs, the higher the odds are that the entire retracement will occur. In the example below, the DJIA dropped from 3,000 to 2350 from July 1990 to mid-October 1990, a total of 650 points. By late January 1991, the DJIA had regained over half of the loss, 325 points, as it moved above 2675. This move represented a 50% retracement of the previous decline and suggested that the DJIA would regain the entire loss before the rally was over. This was accomplished in early march 1991 as the DJIA went on to make a new high. 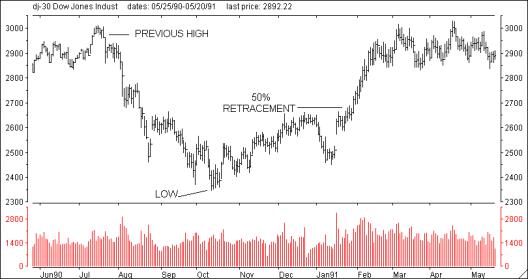 The 50% retracement is the most common of the three situations that we have highlighted. It is also valid in the opposite scenario, after a sustained rally. If 50% of an up move is retraced, anticipate a retracement of the entire move. Fifty-percent retracements occur over and over again providing exceptional profit opportunities for the astute trader.
|
 The market is constantly exposed to conflicting forces. Typically, there is an imbalance one way or the other that results in either a bullish or bearish trend. Whenever the imbalance intensifies, situations set up that usually identify either the end of a major trend or a resumption of an existing trend. These situations repeat over and over again providing exceptional profit opportunities for the astute trader.