 The Right Stock At The Right Time®
| The Right Stock At The Right Time® |
|
||
|
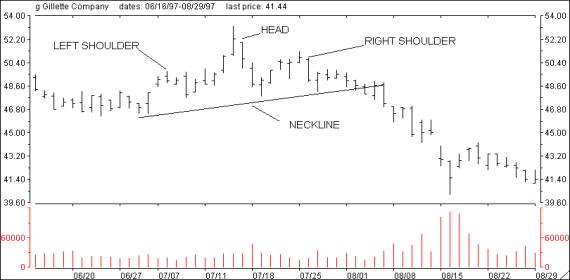
Head And Shoulders Chart Formations Signal Trend Reversals
A head and shoulders pattern is a very strong trend reversal formation. The pattern consists of a left shoulder, the head and a right shoulder. This formation is formed when a stock rallies and forms a top, which is the left shoulder, followed by a minor correction and then a rally to a higher peak, which is the head. Following another retreat, the stock rallies again on lower volume and forms the right shoulder. Usually the peak of the right shoulder is lower than the head and lower than the left shoulder.
When this pattern develops, the chartist draws a straight line which connects the bottoms created during the corrective phases following the formation of the left shoulder and the head. This line is known as the neckline. After forming the right shoulder if the stock breaks through the neckline, a trend reversal is highly probable. If the neckline is not penetrated, a significant price rise is very likely.
To determine the initial price objective, total the number of points from the top of the head to the neckline and subtract the total from the neckline value at the center of the head. This will give you the first downside price projection. Usually this target will be achieved rather quickly with more down side to follow. Reverse head and shoulder formations are the same thing except they are upside down and signal a reversal of a downtrend.
The chart below of Gillette (G) is a good example of a head and shoulder formation that occurred in the summer of 1997. Note that the neckline was broken during the first week of August when G traded below 48. The difference between the head (53) and the neckline (47) was six points. Subtracting six from 47 leaves an initial downward price projection of 41. Gillette traded down to 41 on 08/15/97, rallied for three days up to 44 and then headed back down.
 The chart below of JP Morgan (JP) is a good example of a reverse head and shoulders formation. Note that the neckline was broken on 01/06/03 when JPM traded above 26. The difference between the head (15) and the neckline (26) is 11 points. Adding 11 to 26 leaves an initial upside price projection of 37 which would be a return to the May 2002 high. 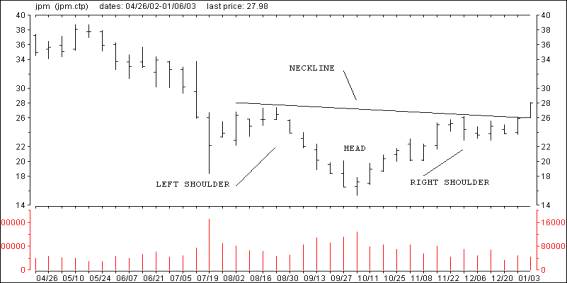
|