 The Right Stock At The Right Time®
| The Right Stock At The Right Time® |
|
||
|
RSI - Relative Strength Index
The Relative Strength Index (RSI) was developed by J. Welles Wilder to detect Overbought and Oversold conditions. The name Relative Strength Index is slightly misleading as the RSI does not compare the relative strength of two securities, but rather the internal strength of a single security.
The RSI is comprised of three variables: 1) the average of all up closing prices during a given period; 2) the average of all down closing prices during the same period; and 3) the length of the period in days over which these averages are taken. RSI measures the degree of strength left in a price trend. If price has been declining and RSI drops to 30 or lower, traders should be alerted to a probable reversal of the downtrend, since momentum would appear to be losing its strength. If RSI moves above 70 as price rises, an intermediate top is usually imminent. The time period used by most traders is nine days.
RSI can be a valuable indicator when timing entry and exit points as well as a good trading tool. When approaching the market from the Buy side, open positions when the stock's RSI approaches 30. Conversely, when initiating a short sale, wait until the RSI approaches 70.
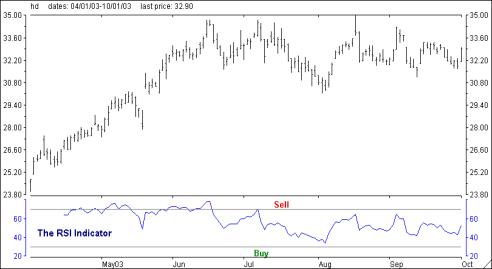
The chart of Home Depot (HD) located below is a good example of price action to be expected when the RSI approaches 70 (Sell) and 30 (Buy). Note the price decline that occurred in early May and mid-June as RSI moved over 70. Conversely, HD recorded a significant bottom in early August as RSI approached 30. RSI also provides a trader with an edge as to when to take a short-term profit, wait for a pullback and then reopen the position.
 The Relative Strength Index should not be confused with 50-Day Relative Strength or with Relative Strength Value (RSV). 50-Day Relative Strength is a comparison of a stocks performance over the previous 50 days with that of the S&P 500 while RSV is a measurement of a stock's performance versus a universe of stocks. Market Edge computes RSI, the 50-Day R-S and RSV for over 4400 stocks on a daily basis. They are included in the Second Opinion report and the various screening modules.
|