 The Right Stock At The Right Time®
| The Right Stock At The Right Time® |
|
||
|
50-Day Relative Strength
Relative Strength (50-Day R.S.) is a technician's term that describes the relative performance or strength of a stock to that of a market index. The index used in the calculation can vary but the S&P 500 is the most popular since it represents a broad gauge of the market's performance. Typically, a stocks percentage gain or loss over the previous fifty-days is compared to the percentage gain or loss of the S&P 500 for the same time period. The result is a number that centers on 1.00. Values greater than 1.00 denote the percentage gain that a stock has out performed the S&P 500 while values less that 1.00 signify under performance. A stock with 50-Day R.S. of 1.50 has out performed the S&P 500 by 50% over the last fifty-days. Conversely, a stock whose 50-Day R.S. is .80 has under performed the S&P 500 by 20% over the same period. Remember that 50-Day R.S. reflects the stock's performance relative to the S&P 500. This means that a stock with a 50-Day R.S. of 1.20 may actually be down in price over the period but would have out performed the S&P 500 by 20%.
Relative Strength can be a valuable tool when selecting stocks. When approaching the market from the Buy side, stocks with strong 50-Day R.S. (greater than 1.00) should be considered for purchases. On the other hand, when the market is deemed to be unfavorable, stocks with weak 50-Day R.S. (less than 1.00) can be prime short-sale candidates. The logic is simple. Stocks, which out-perform the market during a bear phase, are demonstrating strength for a reason. Whatever the fundamental reason is, it should continue to positively influence the price of the stock once the market becomes favorable. Conversely, stocks that are under-performing the S&P 500 during a bull phase will get crushed when the market heads south.
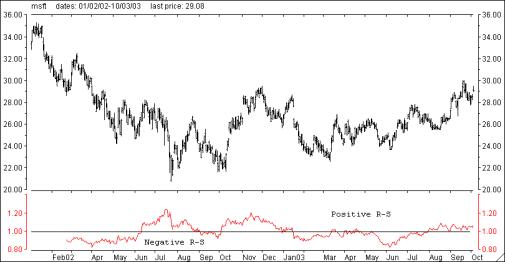
The chart of IBM located below is a good example of price action associated with positive and negative 50-Day R.S. Note the price decline that occurred from February 2002 through June 2002 when IBM's 50-Day R.S. was less than 1.00. From October 2002 through early December 2002 and again from July 2003 through September 2003 the opposite occurred as IBM rallied while its 50-Day R.S. remained over 1.00.
 Relative Strength (50-Day R.S.) shouldn't be confused with Relative Strength Value (RSV) or with Wilder's Relative Strength Index (RSI). RSV is a measurement of a stock's performance versus a universe of stocks. RSV is calculated by totaling the stocks percentage performance for the preceding 12 months or 250 trading days. The calculation is weighted, with the most recent three months assigned a 40% weight, while the previous nine months receive a 60% weight. All of the stocks in the database are then arranged in order of price change and ranked with a value of 99 to 1. A Relative Strength Value of 92 would mean that the stock has outperformed 92% of all other stocks in the database. RSI, developed by J. Welles Wilder detects Overbought and Oversold conditions. RSI measures the degree of strength left in a price trend. If price has been declining and RSI drops to 30 or lower, traders should be alerted to a probable reversal of the downtrend, since momentum would appear to be losing its strength. If RSI moves above 70 as price rises, an intermediate top is usually imminent. Market Edge computes the 50-Day R-S, RSV and RSI for over 4400 stocks on a daily basis. They are included in the Second Opinion report and the various screening modules.
|